Pair Trading Strategy: A Comprehensive Guide
Quick overview: Pair Trading at a glance
| Aspect | Detail |
|---|---|
| Strategy Type | Market-neutral |
| Ideal Market Conditions | Sideways, Mean-reverting |
| Common Asset Classes | Stocks, Forex, Crypto, Commodities, Indices, CFDs |
| Core Tools | Z-Score, Correlation Coefficient, Moving Average |
| Risk Considerations | Correlation breakdown, slippage, execution risk |
| Suitable for Beginners? | Yes, with a basic understanding of hedging & analysis |
Introduction
Pair Trading is a powerful, market-neutral trading strategy that aims to profit from the relative price movement between two correlated assets. Originally developed in the 1980s by Morgan Stanley’s Nunzio Tartaglia, this strategy has evolved from a hedge fund staple to a widely accessible technique used by retail traders around the world.
In this guide, we’ll walk you through how pair trading works, how to identify and manage trade opportunities, and how to apply it using platforms like easyMarkets and TradingView. Whether you’re into stocks, forex or crypto, this strategy has something for you.
What is Pair Trading?
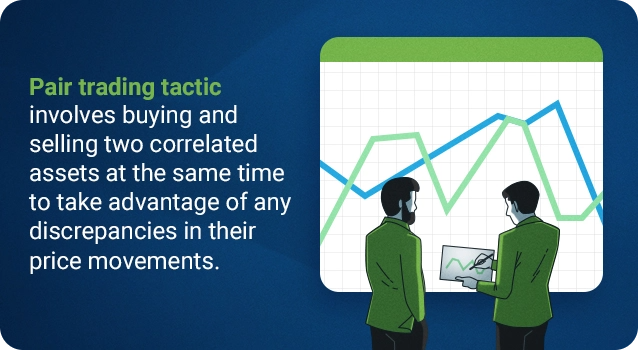
At its core, pair trading (also called statistical arbitrage) involves opening a long (buy) position on one asset and a short (sell) position on another closely correlated asset. The goal is to profit from the price difference between the two, regardless of the market's overall direction.
This strategy is considered market-neutral because it doesn’t depend on the market moving up or down, but on the relationship between the two assets returning to balance.
It’s based on the idea of mean reversion – the assumption that prices eventually revert to their average over time. It works especially well in sideways or range-bound markets, where opportunities for dislocation and convergence are more common.

Key takeaways:
Pair Trading involves going long on one asset and short on a correlated counterpart.
The success of the strategy depends on identifying a strong historical correlation.
This method can reduce exposure to broader market volatility.
It applies to CFDs, futures, options, forex, indices, and crypto.
How the Pair Trading Strategy works
Step 1: Choose a pair of correlated assets
Start by identifying two assets with a strong historical relationship. These could be stocks from the same industry, currency pairs, or indices with similar movement patterns.
Examples: Ford and General Motors, EUR/USD and GBP/USD, Bitcoin and Ethereum.
Step 2: Conduct research and analysis
Go beyond the price chart. Understand the business fundamentals, seasonal trends, and news events that might affect each asset. Check how their correlation behaves over different time frames. Is it stable or just temporary?
You’ll want to verify that the pair’s relationship has remained consistent over time and isn’t skewed by a one-off event.
Step 3: Calculate correlation and spread
Use tools like TradingView or statistical software to calculate the correlation coefficient and monitor the price spread between the two assets. This helps you determine ideal entry and exit points.
Step 4: Monitor with Alerts
Set up a watchlist and create alerts on the easyMarkets trading platform or your preferred interface (MT4, MT5, TradingView). Alerts help you act quickly when correlations change or spreads widen.
Step 5: Define entry and exit rules
Set clear rules for when to enter and exit trades, including correlation thresholds and target spread ratios. Define stop-loss and take-profit levels to manage your risk.
Step 6: Execute the trade
When your conditions are met, open a long CFD position on the undervalued asset and a short CFD position on the overvalued one. Your profit doesn’t depend on whether the market rises or falls – it depends on the price relationship converging.
Step 7: Review and reflect
After the trade is closed, assess your performance. Did the spread behave as expected? Were the signals clear? Review your entry and exit strategy and refine your rules for future setups.
Setting up Pair Trading on TradingView
Pair Trading with easyMarkets using TradingView is a straightforward process. Here’s how to set it up:
Step 1: Create an account
Sign up for a TradingView account and select a subscription that fits your needs.

Step 2: Select a pair
Search for two CFDs that have shown historical correlation. Open each in a new chart tab.
After setting up your account, the next move is to pick your set of securities. Find two financial instruments that closely track each other – this might include stocks, indices, forex, commodities, or others – guided by your research. Head to the main dashboard and enter the name of your first CFD into the search bar, then press enter. A chart for the selected CFD will appear in a new tab.
Repeat this process to create a second CFD chart, allowing you to compare it with the first.

Step 3: Set up your charts
Use TradingView’s multi-chart layout feature to view both CFDs side by side. This makes it easier to monitor divergence and convergence.
To split your chart, click the grid-like chart layout icon at the top right and select your desired layout from the dropdown menu.

Step 4: Identify divergence and convergence
Watch for moments when price movements diverge from their historical ratio. When they begin to converge again, it may be time to exit the position.

Step 5: Set Alerts
Use TradingView's alert system to be notified of price changes or indicator triggers. Just click on the 'Alert' icon situated on the upper left side of the main trading interface. This will bring up a window where you can specify trigger conditions for your alerts, such as changes in the CFD's price or a moving average crossover. Then, you can choose whether you would like to be notified through email or a push notification on your mobile app.

Disclaimer:
The easyMarkets account on TradingView gives you access to tight fixed spreads, tight stop loss distances and negative balance protection. The information provided here is not financial advice and does not constitute a recommendation or an offer.
Pair Trading across markets
Stocks
Stock Pair Trading works best with companies in the same industry or sector, affected by similar news, earnings cycles, and macroeconomic events.
Examples:
- • Coca-Cola (KO) vs. PepsiCo (PEP)
- • Walmart (WMT) vs. Costco (COST)
- • McDonald’s (MCD) vs. Yum! Brands (YUM)
Traders often refer to historical correlation lists or use sector ETFs to find candidates.
Forex
The forex market is perfect for Pair Trading thanks to its high liquidity and predictable price movements. Great examples include major currency pairs like:
- • EUR/USD vs. GBP/USD
- • AUD/USD vs. NZD/USD
These currencies often respond similarly to economic indicators like interest rates, GDP reports, and inflation figures.
Cryptocurrency
Cryptos like BTC and ETH often show periods of strong correlation, especially during broad market rallies or selloffs. However, be careful – correlations can change quickly based on sentiment, regulation news, or tech updates. Use tighter risk management in this space.
CFDs
Contracts for Difference allow you to go long and short without owning the underlying asset. You can use CFDs to trade correlated pairs in:
- • Commodities (e.g., Gold vs. Silver)
- • Indices (e.g., S&P 500 vs. NASDAQ 100)
- • Cross-asset (e.g., Oil vs. Oil Stocks)
CFDs offer leverage, which can magnify returns, but also amplify risks, so risk management is key.
Real-world example
Example 1: Apple vs. Microsoft
Apple launches a new product and rallies, while Microsoft stays flat. The spread widens. A trader opens a short on Apple and a long on Microsoft, expecting the relationship to normalize. When the hype fades and the spread tightens, the trade is exited with a profit.
Example 2: Index Arbitrage
Indices A and B normally trade at a 0.55 ratio. A shift to 0.56 signals divergence. The trader goes long on the cheaper index and short on the pricier one. As they revert, the spread closes, resulting in a profit, assuming the correlation held firm.
Example 3: Failed Trade
Two tech companies diverge, but the reason is fundamental: one misses earnings. A trader executes a pair trade without understanding the news, and the spread widens further. The trade closes at a loss, reminding traders that not all divergences are technical.
Tools for Pair Traders
Correlation Matrix – A visual tool showing asset relationships
Z-Score Calculator – For identifying statistical extremes
Moving Averages (MA) – Track trend and mean over time
Cointegration Analysis – For more advanced confirmation of pair stability
TradingView / MetaTrader / easyMarkets – Platforms for charting, execution, and alerts
Advantages of Pair Trading
The pair trading strategy comes with several enticing benefits that stand out from conventional trading techniques:
1. Market neutral:
Performance depends on relative asset movement, not market direction.
2. Risk management:
Since pair trading inherently involves hedging one investment against another, it has the potential to substantially minimize investment risks.
3. Applicable across markets:
Pair trading isn't confined to just one kind of asset or marketplace, showcasing its adaptability in various trading environments.
Disadvantages of Pair Trading
However, the strategy also carries certain drawbacks:
1. Correlation risk:
If correlation breaks down, the strategy may fail.
2. Complexity:
Requires strong analytical and monitoring skills.
3. Time-intensive:
Demands continuous research and tracking.
Is Pair Trading right for you?
You might benefit from pair trading if you:
Prefer logical, rules-based strategies
Are comfortable using technical/statistical tools
Want to reduce exposure to overall market direction
Have time to monitor positions regularly
However, if you’re new to short selling or prone to emotional trades, you might start with demo accounts before trading real capital.
Conclusion
Pair trading is a smart, research-driven strategy that uses logic and data, not guesswork, to make trading decisions. While it requires patience, discipline, and proper risk controls, it can deliver consistent opportunities across any market environment.
Explore pair trading with a demo account, refine your process, and when you’re ready, go live with a strategy that’s as flexible as the markets themselves.
Quick overview: Pair Trading at a glance
| Aspect | Detail |
|---|---|
| Strategy Type | Market-neutral |
| Ideal Market Conditions | Sideways, Mean-reverting |
| Common Asset Classes | Stocks, Forex, Crypto, Commodities, Indices, CFDs |
| Core Tools | Z-Score, Correlation Coefficient, Moving Average |
| Risk Considerations | Correlation breakdown, slippage, execution risk |
| Suitable for Beginners? | Yes, with a basic understanding of hedging & analysis |
Introduction
Pair Trading is a powerful, market-neutral trading strategy that aims to profit from the relative price movement between two correlated assets. Originally developed in the 1980s by Morgan Stanley’s Nunzio Tartaglia, this strategy has evolved from a hedge fund staple to a widely accessible technique used by retail traders around the world.
In this guide, we’ll walk you through how pair trading works, how to identify and manage trade opportunities, and how to apply it using platforms like easyMarkets and TradingView. Whether you’re into stocks, forex or crypto, this strategy has something for you.
Frequently Asked Questions
Look for assets in the same sector with similar fundamentals and historical correlation. Use charting tools and statistical analysis to confirm relationships.
Some common tools and software include statistical analysis software such as R or MatLab, charting and technical analysis software such as TradingView, and trading platforms that support the best Pairs Trading Strategies like the easyMarkets trading platform
It’s effective in sectors with high correlation, such as finance, tech, and commodities.
Ignoring correlation, not monitoring trades, overfitting strategies to past data, and underestimating transaction costs.
It depends on the setup. Trades may last from a few days to several weeks based on spread normalization.
Use stop-losses and reassess the fundamentals. Don’t wait forever for mean reversion.
Yes, volatility often creates dislocations. Just tighten your risk limits.
Yes, including Relative Value Trading, Statistical Arbitrage, and Cointegration-based strategies.
A z-score measures how far the spread between two assets is from its historical mean in terms of standard deviations. It helps identify when prices are stretched and may revert.
The spread can be calculated as the price difference or ratio between the two assets. Many traders normalize this using a z-score.