Understanding MACD: A key indicator in Trend Trading
MACD, short for Moving Average Convergence Divergence, is a powerful tool used by traders to spot trend direction, momentum shifts, and potential entry or exit points. As a momentum-based,trend-following indicator, MACD helps traders understand how an asset’s price is behaving relative to its historical average.
Let’s break down what MACD is, how it works, and how traders use it to make better decisions.
What is MACD?
MACD is a trend-following indicator that uses Exponential Moving Averages (EMAs) to measure momentum.
MACD Line: The difference between the 12-day EMA and the 26-day EMA.
Signal Line: A 9-day EMA of the MACD line, used to generate signals.
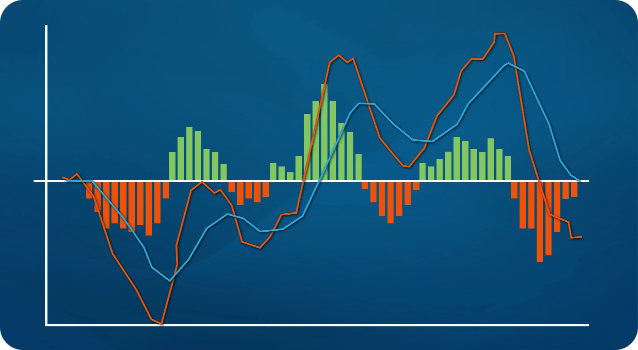
Histogram (optional on some platforms): Shows the difference between the MACD line and the signal line visually.
This indicator helps traders identify shifts in momentum and spot potential trade setups.
How is MACD calculated?
The MACD line is calculated by subtracting the 26-period EMA from the 12-period EMA:
MACD Line = 12-day EMA – 26-day EMA
The Signal Line is a 9-day EMA of the MACD Line:
Signal Line = 9-day EMA of MACD Line
Most platforms display the MACD as two lines (MACD and Signal) and sometimes a histogram, which visually represents the distance between the two lines.
How to read MACD signals
Traders use MACD in a few key ways. Let’s look at the three most common interpretations:
Dramatic Rise
When the MACD line rapidly moves away from the signal line, it often indicates the asset is overbought, especially if confirmed by another indicator, such as the Relative Strength Index (RSI). This may signal that the asset is poised for a pullback or reversal.
Tip: Use RSI to cross-verify MACD overbought signals and avoid false alarms.
Crossover
This is the most common application of the MACD. A bullish crossover – when the MACD line moves above the signal line – indicates upward momentum. Conversely, a bearish crossover – when the MACD line drops below the signal line – signals downward momentum.
Most traders wait for the crossover to hold (i.e., not reverse quickly) before acting, as premature signals can lead to losses.
Divergence
Divergence is when the asset price moves in the opposite direction of the MACD line. This is often a strong signal of a potential trend reversal.
Bullish divergence: Price makes lower lows while MACD makes higher lows.
Bearish divergence: Price makes higher highs while MACD makes lower highs.
Again, divergence signals should be confirmed with other tools to avoid reacting to short-term noise.
MACD on Different Timeframes
MACD behaves differently depending on the timeframe you apply it to. On very short charts, such as the 1-minute or 5-minute timeframe, MACD reacts quickly but also generates far more noise. This can lead to frequent crossovers and false signals caused by minor price fluctuations.
On higher timeframes, like 4-hour or daily charts, MACD produces fewer signals that tend to be more reliable because they reflect broader trend momentum rather than short-term volatility.
For new traders, this distinction is important: relying on MACD alone on lower timeframes often results in overtrading or chasing misleading momentum shifts. Higher timeframes generally provide clearer, more actionable MACD setups.
What is the Zero Line?
The zero line is the point at which the MACD line equals zero – where the 12-day and 26-day EMAs are equal.
When the MACD line crosses above the zero line, it can suggest upward momentum.
When it crosses below the zero line, it may signal continued downward pressure.
Signals from the zero line often lag, as the move has already been developing for some time once it crosses.
Key takeaways
MACD is a reliable and versatile technical analysis tool used across all markets – from forex and stocks to crypto. While it shouldn't be used in isolation, it can provide strong entry or exit signals when combined with other indicators, such as RSI or trendlines.
Whether you’re new to trading or fine-tuning your strategy, understanding the MACD is a key step toward making more informed and confident trading decisions.
MACD, short for Moving Average Convergence Divergence, is a powerful tool used by traders to spot trend direction, momentum shifts, and potential entry or exit points. As a momentum-based,trend-following indicator, MACD helps traders understand how an asset’s price is behaving relative to its historical average.
Let’s break down what MACD is, how it works, and how traders use it to make better decisions.